


Executive comparison
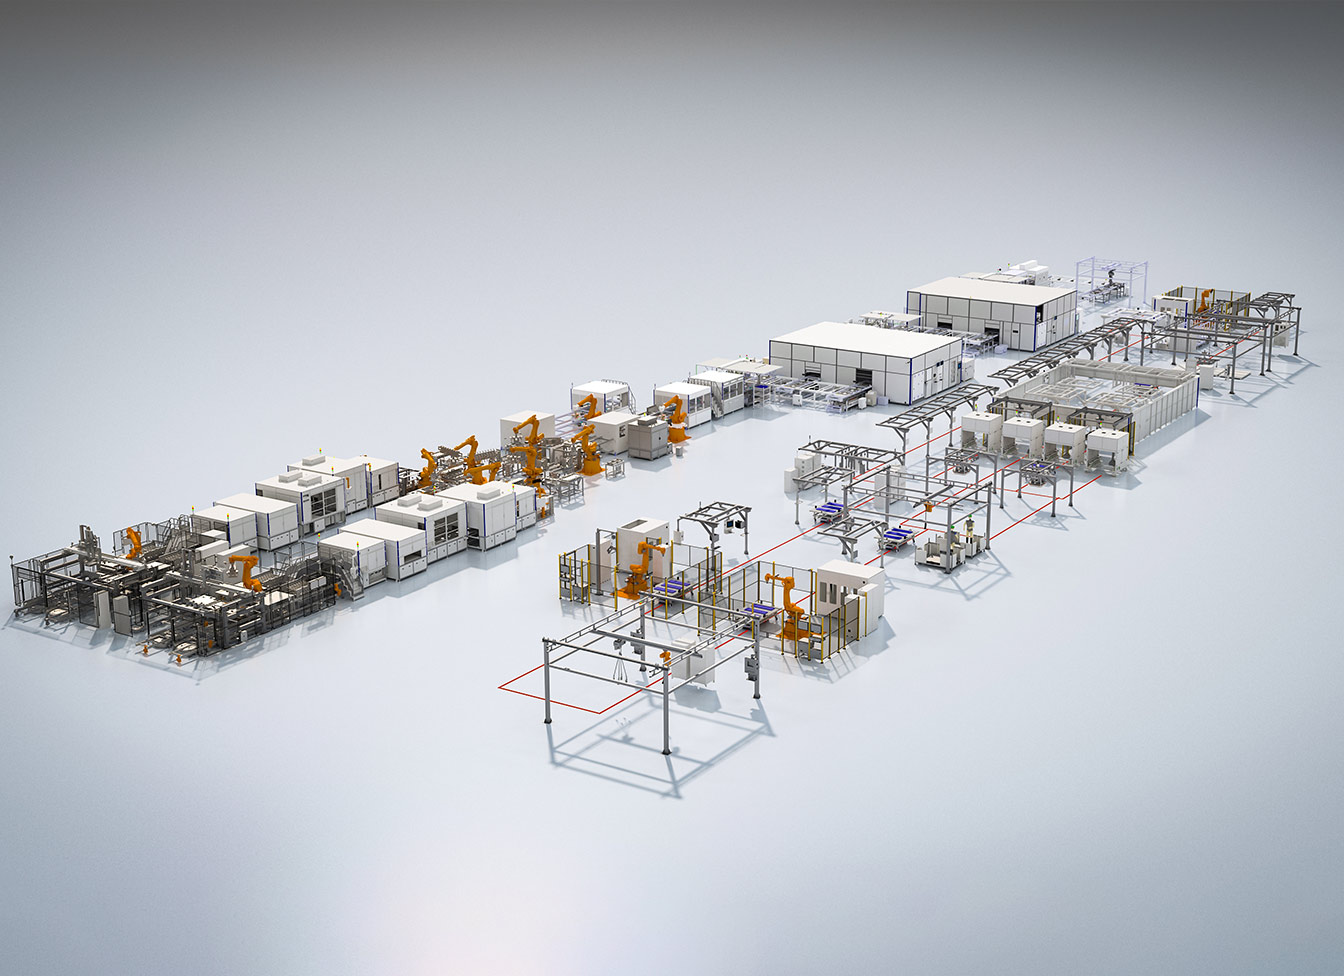
Investors want a clear signal: does an automation purchase create lasting value or just a short-term cost swing? Start by mapping uptime, throughput and obsolescence risk against capital outlay and integration spend. Working with established battery pack assembly suppliers changes integration assumptions and often reduces initial unknowns — seen practically at the Tesla Gigafactory in Nevada, where line-level choices shifted whole-factory economics. This piece compares what you must measure to see whether automation is an investment or an expense.

What “lifecycle value” and “total cost” mean here
Lifecycle value = the net operational benefit over the expected life of the equipment. Total cost = all cash flows required to deploy and run the system. Compare them with consistent metrics:- Operating margin impact per unit of throughput.- Net Present Value (NPV) or discounted cash flow across expected life.- Mean time between failures (MTBF) and maintenance labor hours.- Retrofit and integration hours with existing PLCs and MES.Measure these the same way for every vendor to avoid apples-to-oranges conclusions.
Key comparative metrics and how to weight them
Place heavier weight on metrics that drive revenue or reduce recurring cash outflows. Typical weighting for investors:- Throughput sensitivity: high weight if capacity limits sales.- Downtime cost: high when each hour stops production lines.- Consumable and energy costs: medium weight for long-run margins.- Flexibility/adaptability: medium to high where product mix changes.- Capital recovery and resale value: low to medium, unless secondary market exists.Scoring must reflect your company’s constraints; a high-capex player can accept longer payback if throughput grows revenue.
Three practical scenarios for comparison
Scenario A — Greenfield investment: choose automation that maximizes throughput and minimizes lifecycle energy and labor costs. Scenario B — Retrofit: prioritize modular interfaces and low integration risk. Scenario C — Flexible multi-model line: prioritize retool time and software configurability. For each scenario compute:- 5-year cash flows.- Break-even throughput uplift.- Sensitivity to labor cost changes.These scenarios reveal which vendors give durable value versus those that merely lower sticker price.
Common pitfalls that distort comparisons
Watch for these traps:- Comparing quoted cycle times instead of tested cycle times under production conditions.- Ignoring software licensing renewals and middleware fees.- Underestimating systems integration and validation labor.- Treating spare parts and consumables as negligible.- Overlooking training and change-management friction.Avoid these and your lifecycle model will reflect reality rather than vendor optimism.
Vendor selection and cost-modeling checklist
Use a structured due diligence routine:- Request validated performance data under third-party audit or factory acceptance tests.- Count all recurring fees and consumables for a 7–10 year horizon.- Model obsolescence risk and upgrade pathways; prefer modular hardware and open protocols.- Validate maintenance plans and mean time to repair (MTTR).- Confirm references that use comparable product mixes.When evaluating specific machines, include the cost of compatible battery cell manufacturing equipment and how that affects line-level interactions.
Decision checklist investors can act on now
Make decisions with these concrete steps:- Build an NPV model with scenario sensitivity to downtime and labor inflation.- Require vendor-provided real-world run-rate data and on-site references.- Insist on clear interface specs and a written integration timeline.- Value flexibility by pricing reconfiguration time in hours, not vague promises.Follow this checklist and the comparison favors suppliers that deliver measurable, durable gains.
Final synthesis
Compare lifecycle value and total cost with a single-minded focus: which option preserves margin under stress and scales with demand. Quantify risks, price integration correctly, and prefer modular solutions when future product changes are probable. That disciplined comparison explains why experienced operations teams move beyond lowest price and toward partners whose designs sustain throughput and margin over years — a perspective that aligns with what FHS cites when assessing long-term equipment value.