

Opening: Why metrics, not instincts, should run your fleet
Decisions that change operating margin come from numbers, not guesses. If you manage vans for last-mile delivery or a mixed light-vehicle fleet, prioritize a concise set of indicators and systems that make performance visible. Effective bus fleet management data and integrations often mirror what’s used in larger transit networks; that alignment helps when fleets scale or interoperate with municipal partners, and it ties into broader smart public transportation system thinking used by city agencies. A single dashboard that tracks utilization, route adherence, fuel or energy per kilometer, and unscheduled downtime converts routine choices into measurable improvements.
Core metrics every van fleet must measure
Focus on five indicators first. Use the numbers to decide policy, not the other way around.- Utilization rate: percent of total available vehicle-hours that are assigned to revenue work. Target range: 60–85% depending on service model.- Cost per kilometer: combine fuel/energy, driver labor, maintenance and overhead. Watch this monthly; shifts >5% require action.- Mean Time Between Failures (MTBF) and unscheduled downtime: measure in operational hours. Aim for steady upward trends.- On-time delivery adherence: percentage of stops met within your SLA window.- Telematics signal health: the share of trips with full GNSS + diagnostic coverage; below 95% flags data gaps.
Telematics and software: what to choose and why
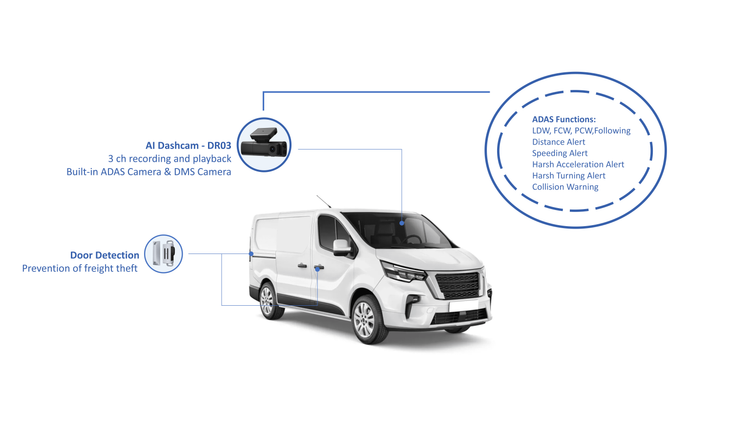
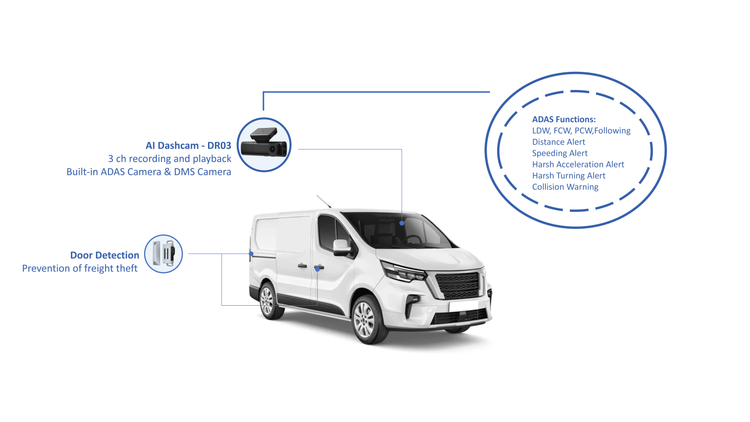
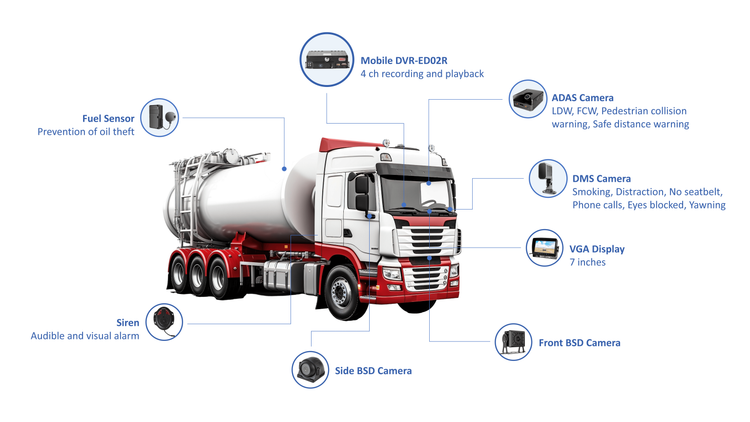
Assess solutions by the data they produce, not features lists. Prioritize systems that deliver:- high-frequency location and engine diagnostics,- open APIs for export,- edge processing that reduces cellular cost,- and event tagging (idle, hard-brake, door-open).Transport for London (TfL) shows how real-time feeds matter at scale: agencies that publish consistent telemetry enable routing and performance tools to converge, shortening the feedback loop between operations and dispatch. Choose vendors that provide raw telemetry access in addition to dashboards so your analysts can validate and recreate metrics.
Maintenance, parts, and downtime control
Maintenance strategy must shift from calendar-driven to condition-driven. Two practical moves:- Move predictable work forward: schedule preventive service based on odometer and diagnostic fault codes rather than fixed intervals.- Create a priority ladder for downtime: A (safety-critical), B (operationally disruptive), C (cosmetic). Track average time-to-repair by ladder.Common cost leak: spare-parts inventory bloating. Hold critical SKUs at local depots; centralize slow-moving parts and use data to set reorder points. Measure success by reduction in mean repair time and parts stockouts.
Routing, dispatch, and utilization tactics
Small routing optimizations compound across hundreds of trips. Run five experiments quarterly:- Consolidate pickups within 2 km of each other and measure effect on stop time.- Test split-shifts vs. continuous runs for driver utilization.- Use dynamic batching to reduce empty miles.- Implement micro-zoning for nearest-vehicle dispatch.- Reevaluate depot and sub-depot placement against heatmaps of start/end locations.Collect before/after metrics for each experiment: fuel use, delivered stops per hour, and driver hours per route.
Operational playbook: concise checklist for the first 90 days
Deploy a focused, measurable rollout:1. Baseline: capture 30 days of raw telemetry and delivery outcomes.2. Clean data: remove trips with telemetry gaps and normalize time zones.3. Target-setting: set three KPIs to improve by specified percentages.4. Pilot: run a single depot or region with adjusted routing and maintenance rules.5. Review: compare pilot against baseline and scale what hits targets.Keep the playbook under two pages so dispatchers actually use it.
Common pitfalls and how to avoid them
Operators repeatedly make avoidable errors:- Over-customizing dashboards so analysts can’t compare sites. Standardize views.- Chasing marginal tech features instead of fixing data integrity. Fix the feed first.- Ignoring driver incentives that directly affect measured behavior. Tie a small portion of pay to clear safety and on-time metrics.- Failing to validate third-party vendor data against onboard diagnostics. Audit monthly.
Comparative brief: three solution types and when they fit
Quick evaluation to guide procurement:- Telematics-first platforms: best when you need detailed engine and sensor data. Good for fleets with mixed vehicle ages.- Routing-first systems: prioritize if scheduling and stop density drive costs. Works when telematics exist but routing is manual.- Integrated fleet management suites: choose when you need unified maintenance, routing, and driver workflows; expect higher upfront integration effort.Run a 60–90 day technical pilot before committing; measure the identified core metrics and refuse scope creep during evaluation.
Final synthesis
Data drives the decisions that reduce costs and improve service. Start with the handful of metrics that reveal utilization and reliability, validate telemetry quality, shift maintenance toward condition-based rules, and run short, measurable experiments on routing and dispatch. Practical experience with municipal and private fleets shows these steps cut downtime and lower cost per kilometer. For organizations that want a proven bridge between vehicle-level telemetry and city-scale operations, BSJ offers integration patterns and tooling that align fleet performance with smart public transportation system principles established in major transit agencies.