


Comparative lead-in: why the shipment stage matters
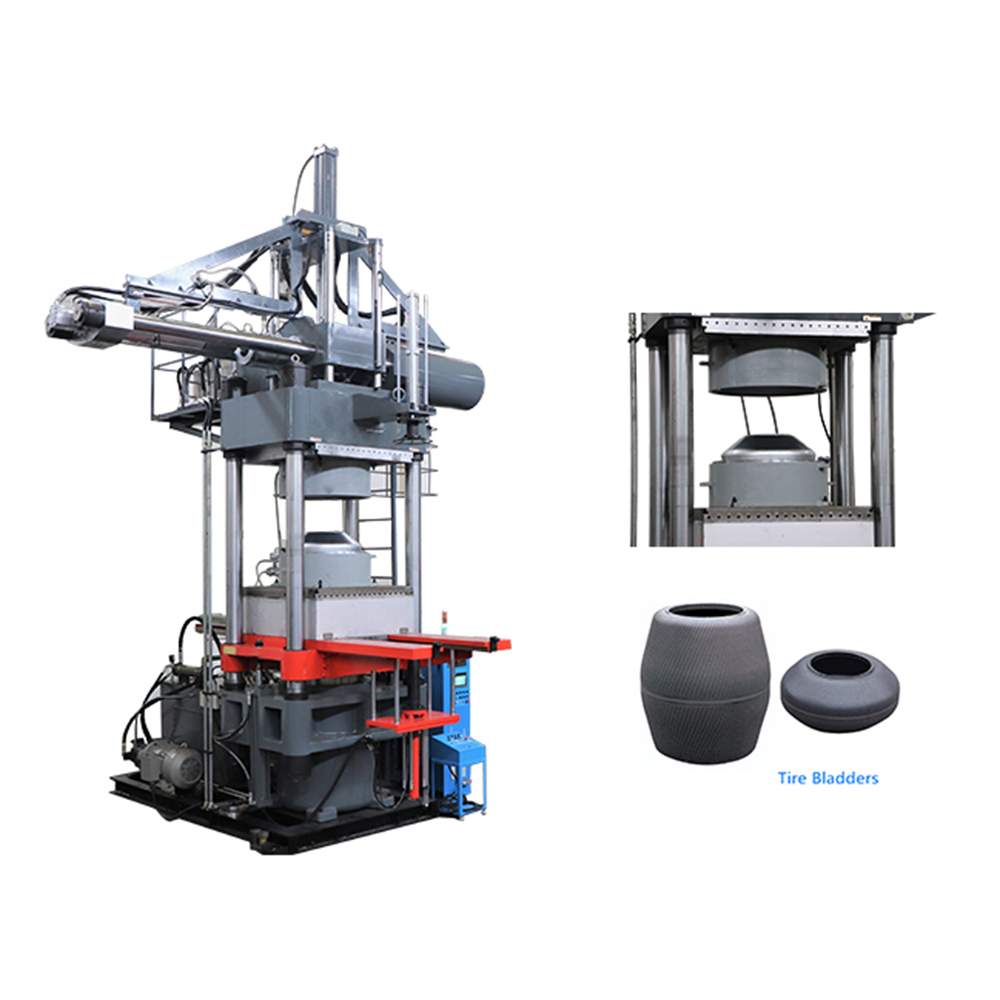
When OEMs decide where to source components for rubber vulcanizing lines, the shipment step often carries an outsized share of embodied emissions. This piece compares supplier-level choices—factory location, batch size, and transport mode—and how they affect carbon intensity and energy consumption. Practical differences show up in both machine design and logistics: a European supplier shipping modular modules will profile differently than a single large crate containing a c frame rubber injection molding machine. The comparison focuses on measurable metrics, not vague claims, so procurement teams can make choices that reduce scope 3 emissions while keeping production stable.

Key metrics to compare across suppliers
Three primary, comparable metrics give a direct read on sustainability performance:
– Tonnes CO2e per unit shipped (including upstream components and transport).
– Energy consumed per functional hour of machine operation (kWh), accounting for installation and commissioning transport energy.
– Delivery cycle time and its impact on inventory holding and emergency airfreight needs.
These metrics align with international reporting norms introduced after the Paris Agreement (COP21, 2015), which pushed manufacturers toward transparent scope 3 accounting. Use consistent system boundaries when requesting supplier data: cradle-to-dock for components, cradle-to-site for full machines. Industry terms to watch: vulcanization, cycle time, curing temperature.
Comparative profiles: air, sea, and regional assembly
Air freight delivers speed but multiplies carbon intensity. Sea freight drops CO2 per tonne-kilometre dramatically but can extend lead times and increase warehousing energy. Regional assembly—shipping pre-assembled modules to a nearby plant for final assembly—often balances the two by reducing oversized air shipments and optimizing container packing. Press tonnage and mold cavity size influence packing efficiency: larger tonnage presses need different crating and handling, which alters transport emissions.
Supplier-side decisions that shift the balance
Suppliers can lower shipment carbon in three practical ways: redesign crating to reduce dead volume, use low-carbon shipping contracts, and invest in local subassembly. Hydraulic system choices matter too; a machine with an efficient hydraulic pump and lower idle power will dilute embodied shipping emissions across more productive hours. Small changes in curing temperature control or insulation on ovens save operational energy—so a marginally higher shipping load can be justified if operational kWh falls significantly.
Common mistakes and better alternatives
Procurement teams often default to lowest purchase price, ignoring shipping carbon and downtime risk. That falls short. Typical missteps include:
– Paying for airfreight on long lead items instead of redesigning delivery cadence.
– Accepting opaque supplier LCA claims without consistent boundaries.
– Over-specifying press tonnage and forcing bespoke crates that waste space.
Better alternatives are simple: standardize modules for container-friendly dimensions, require supplier LCAs with cradle-to-site scope, and specify energy metrics alongside unit cost. When evaluating heavy equipment, consider how a c frame hydraulic press with modular frames might reduce both shipping volume and on-site assembly time—this often pays back in lower total emissions and faster ramp-up.
Real procurement checklist
Use this checklist when comparing suppliers. It helps separate legitimate improvements from marketing:
– Provide consistent system boundaries for LCA data requests.
– Require transport mode breakdown (sea/road/air) and container utilization rates.
– Ask for machine operational kWh per 1,000 cycles and expected lifetime hours.
– Confirm local assembly capabilities and spare parts sourcing plans.
Advisory: three evaluation metrics to make choices that endure
1) Carbon intensity per installed production hour: combine embodied shipment emissions with expected operational kWh to get true CO2 per hour. This metric reveals long-term climate impact.
2) Container-fill efficiency and packaging dead volume: a direct proxy for transport emissions efficiency—improvements here cut scope 3 fast.
3) Supplier transparency score: consistent LCA scope, verified data, and a plan for continuous improvement. Score suppliers and weight this into total cost of ownership.
Choosing a supplier is not just about the machine on day one; it is about predictable operations and measurable emissions across the equipment lifecycle. HWAYI offers machines and modular approaches that align these goals—delivering lower transport carbon, clear operational metrics, and reliable on-site performance. –